Summary: in this tutorial, you’ll learn how to use the PostgreSQL VAR_POP aggregate function to calculate the population variance of a set of values.
Getting Started with the PostgreSQL VAR_POP aggregate function #
A population variance measures how much values differ from the mean (or average). Population variance is an essential indicator because it reflects the spread or dispersion of the data points.
The following steps illustrate how to calculate the population variance:
- First, calculate the average (or mean) of all the values.
- Next, find each value’s difference (or deviation) from the mean.
- Then, square each deviation to ensure all the values are positive.
- After that, sum all the squared deviations.
- Finally, divide the sum by the number of values to get the population variance.
The following shows the formula to calculate the population variance:

where:
- σ2 is the population variance.
- xi is each individual value.
- μ is the population mean.
- N is the number of values in the population.
PostgreSQL offers the VAR_POP aggregate function to calculate the population variance.
Syntax #
Here’s the syntax of the VAR_POP aggregate function:
SELECT
  VAR_POP(column1)
FROM
  table_name;Code language: PostgreSQL SQL dialect and PL/pgSQL (pgsql)
In this syntax, the VAR_POP function takes all values in column1 and returns the population variance.
The VAR_POP function ignores NULL in column1. It only takes non-NULL to calculate the population variance.
If column1 has no value, i.e., no rows to aggregate, the VAR_POP function returns NULL.
Calculating the Population Variance for Groups #
To calculate the population variance for groups, you can use the VAR_POP function with the GROUP BY clause:
SELECT
  column2,
  VAR_POP(column1)
FROM
  table_name
GROUP BY
  column2;Code language: PostgreSQL SQL dialect and PL/pgSQL (pgsql)
In this syntax:
- The
GROUP BYclause divides the rows in thetable_nameby the values incolumn2into groups. - The
VAR_POPfunction calculates the population variance for values incolumn1in each group.
PostgreSQL VAR_POP Aggregate Function Examples #
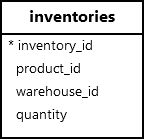
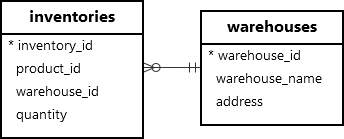
Let’s explore using the VAR_POP function with practical examples based on an inventory database.

Calculating the Population Variance of Inventory #
The following statement uses the VAR_POP function to calculate the population variance of product quantity in the inventory:
SELECT
  VAR_POP(quantity) AS population_variance
FROM
inventories;Code language: PostgreSQL SQL dialect and PL/pgSQL (pgsql)Output:
  population_variance
-----------------------
 4608.6400000000000000Code language: PostgreSQL SQL dialect and PL/pgSQL (pgsql)
The output sample variance indicates how much the inventory quantities differ from the mean.
Calculating the Population Variance of Inventory by Warehouse #
The following statement uses the VAR_POP function with the GROUP BY clause to calculate the population variance of inventory by warehouse:
SELECT
  warehouse_id,
  ROUND(VAR_POP(quantity), 0) AS population_variance
FROM
  inventories
GROUP BY
  warehouse_id;Code language: PostgreSQL SQL dialect and PL/pgSQL (pgsql)
Try it
Output:
 warehouse_id | population_variance
--------------+---------------------
            3 |                3994
            2 |                3686
            1 |                5889Code language: PostgreSQL SQL dialect and PL/pgSQL (pgsql)
In this example:
- First, the
GROUP BYclause divides the rows by thewarehouse_idinto groups. - The
VAR_POPfunction calculates the population variance for inventory in each group.
If you want to retrieve the category name, you can join the inventories table with the warehouses table:

SELECT
  warehouse_name,
  ROUND(VAR_POP(quantity), 0) AS population_variance
FROM
  inventories
  JOIN warehouses USING (warehouse_id)
GROUP BY
  warehouse_name;Code language: PostgreSQL SQL dialect and PL/pgSQL (pgsql)
Try it
Output:
     warehouse_name      | population_variance
-------------------------+---------------------
 San Francisco Warehouse |                3686
 Los Angeles Warehouse   |                3994
 San Jose Warehouse      |                5889Code language: PostgreSQL SQL dialect and PL/pgSQL (pgsql)
The output shows the variability of inventory within each warehouse. The warehouse with a higher population variance might have a broader range of inventory quantity.
Summary #
- Use the
VAR_POPaggregate function to calculate the sample variance of a set of values.